By David Erzen, Research Manager (Africa Business Unit) and Yuliya Dudaronak, Research Director
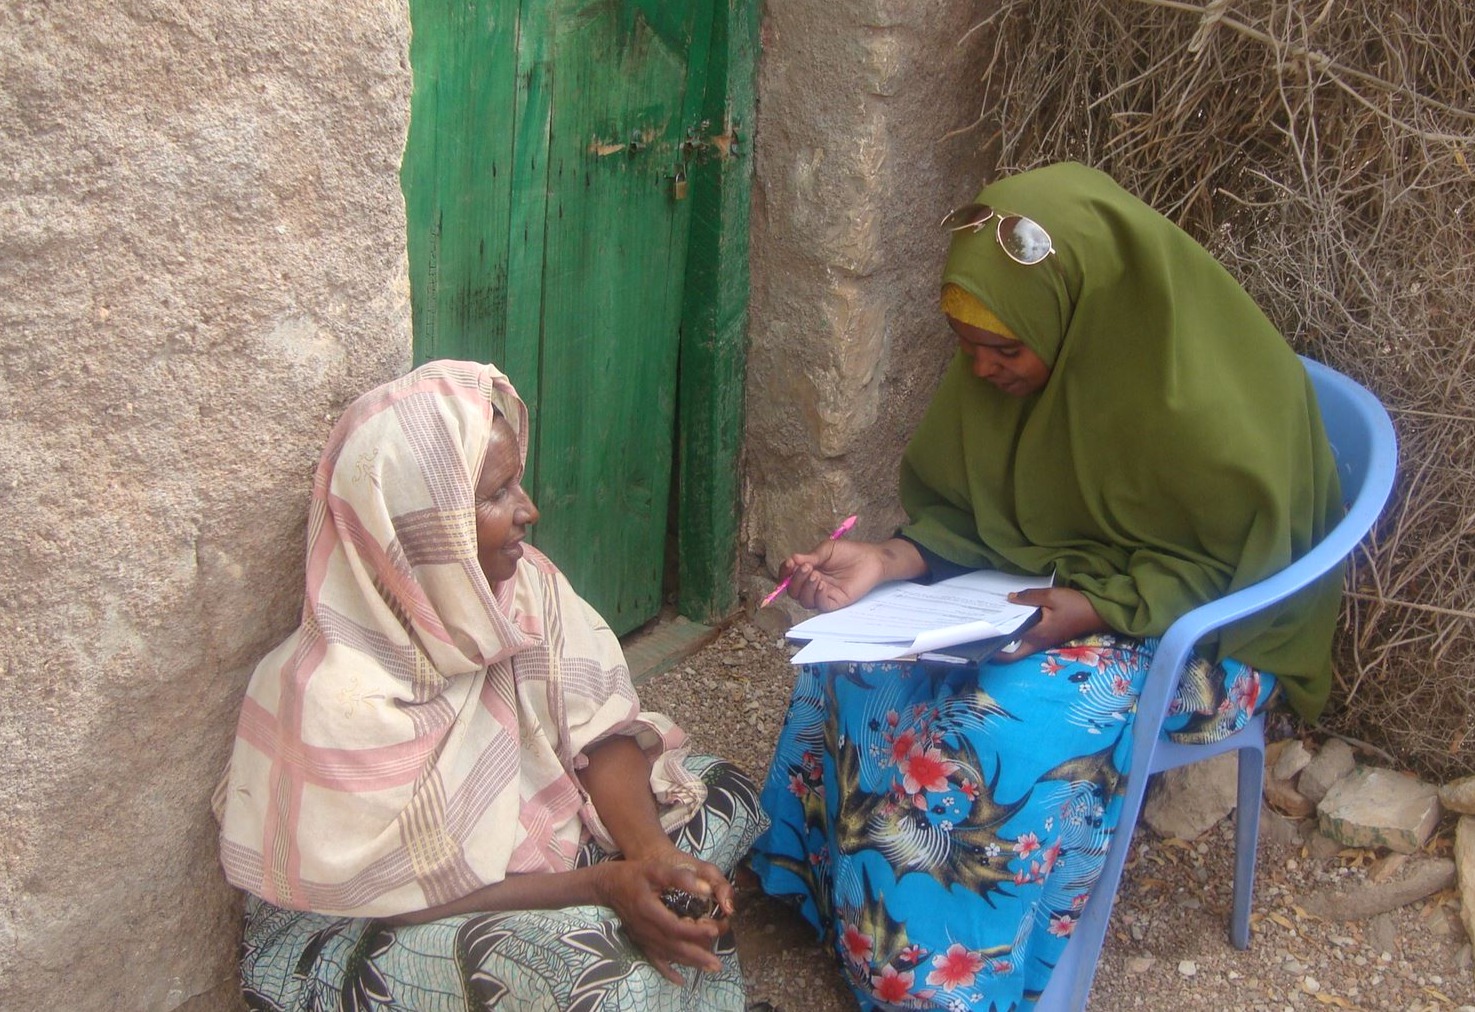
Image 1: ORB Fieldwork in Somalia
Conducting face-to-face survey research during times of conflict is never easy, but it isn’t impossible. In Sudan, war, mass displacement, and infrastructure collapse have disrupted nearly every aspect of daily life. To sustain meaningful, timely data collection for ORB’s tracking study, ongoing since 2020, we’ve relied on one thing above all: integrating tools and tactics across every layer of the research process.
Whether that meant combining displacement data with gridded population frames, layering human validation over machine-generated designs, or reinforcing field protocols with technical safeguards, this was never about one silver-bullet solution. It was about aligning systems to stay responsive, even when everything else was in flux.
From Static Frames to Dynamic Design
Even before the conflict escalated in April 2023, Sudan posed significant challenges for representative sampling. With no census since 2008, we couldn’t rely on traditional population frames. Instead, ORB turned to gridded population sampling; an approach that uses satellite imagery and spatial models to estimate where people are likely to be living at a highly localized level. This method has proven essential in settings where reliable population estimates don’t exist.
But when the war broke out and displacement surged – more than 2 million people were displaced in just the first two months, according to the UN’s International Organization for Migration (IOM)1 – it became clear that even gridded estimates couldn’t keep up. The pace and scale of population movement quickly outstripped a static approach. To ensure our study remained representative and relevant, particularly to the communities most affected by infrastructural damage, village fires, and armed group activity, we needed to adapt.
Our response was to integrate real-time displacement tracking into the sampling framework. We used the latest IOM estimates2 to reallocate interviews based on shifts in population, ensuring that states receiving large numbers of internally displaced people (IDP), especially from Khartoum, were proportionately represented. To validate these adjustments in the field, we added survey questions to capture respondents’ state of origin. This allowed us to cross-check our sample design against real-time patterns of displacement.
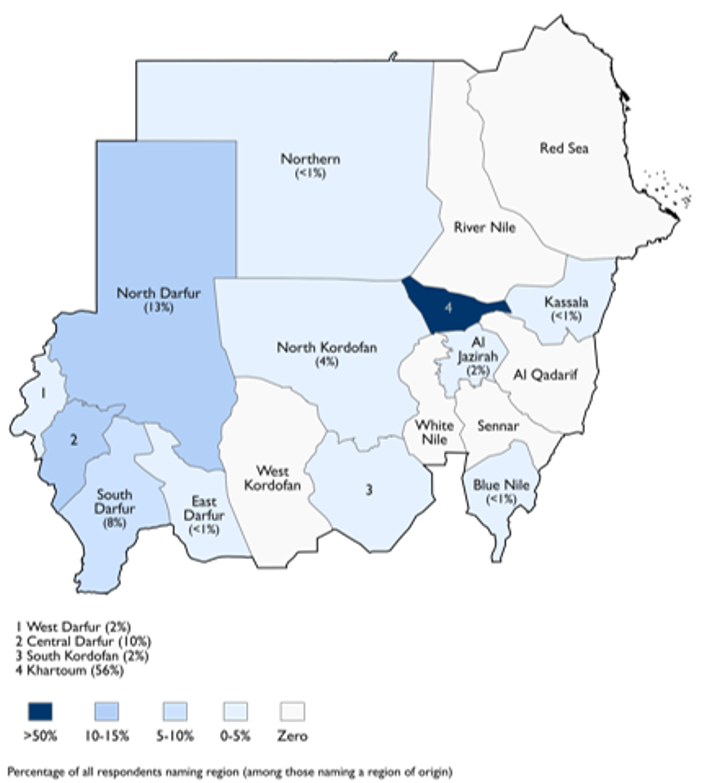
Image 2: IDP region of origin map
The results? In several regions, our data revealed even more extensive movement than IOM had projected. Rather than undermining our approach, that divergence affirmed its value. It underscored the need for adaptive design grounded in both secondary data and lived experiences of local teams – especially when working in fast-changing, high-stakes environments.
Protocols That Plug Into People
No design survives contact with the field unless there’s an operational backbone to support it. Our location access protocols gave enumerators clear, measurable criteria for when and how to substitute inaccessible sampling locations, or PSUs: approach the PSU from multiple directions; assess visible signs of abandonment or recent conflict; and record specifics. If you can’t get within five kilometers, don’t improvise, rather, return to network access and check in.
But we didn’t stop with field checks. Every substitution was reviewed by our QC teams, who applied satellite-based gridded population data to evaluate whether the substituted PSU reflected the original target’s characteristics (urbanity, infrastructure, density). This allowed us to correct for unavoidable sampling breakdowns without losing analytical coherence.
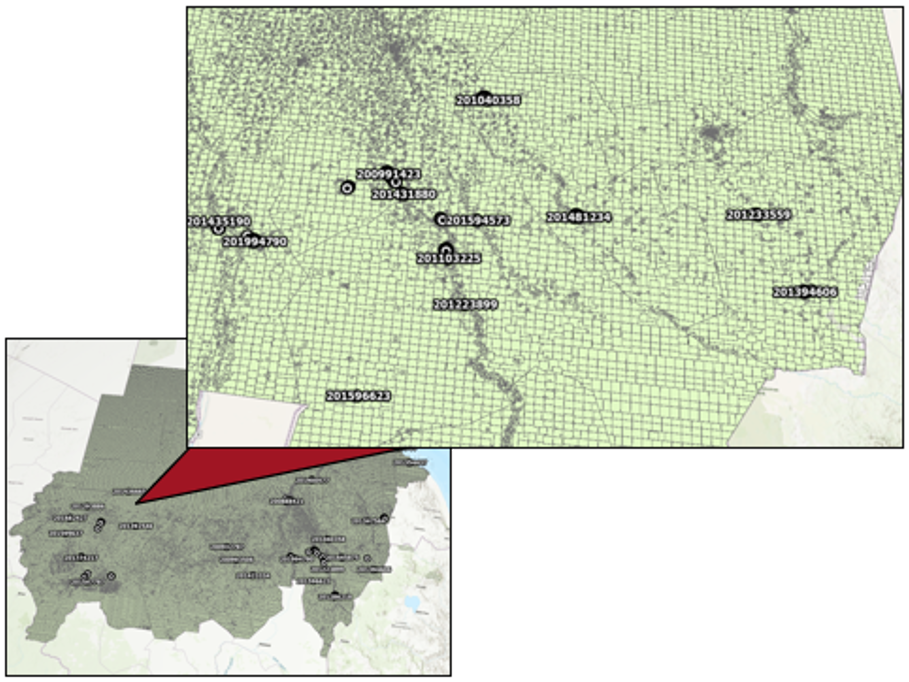
Image 3: ORB’s cross-checked field-based replacements
This was integration in practice: human fieldwork, geospatial tech, and remote quality control working in tandem to protect data integrity.
Layered Systems, Not Single Solutions
In Sudan, the idea of a single ‘solution’, whether technical or logistical, rarely held. Satellite internet connections helped with data uploads, but weren’t available everywhere. Displacement data shaped allocation tables, but needed ground-truthing. And centralized training of enumerators was impossible once the conflict severed transport routes.
Instead, we layered:
- Technical tools (Starlink, Thuraya, GPS-tagged uploads)
- Process adaptations (regional micro-trainings, audio walkthroughs, hyperlocal hiring from existing civil-society organizations)
- Data triangulation (IDP tracking + PSU substitution logs + gridded reclassification)
Each element filled in for others when they failed. Together, they created resilience; not perfection, but enough consistency to keep generating meaningful, usable insights.
Integration is Key
None of these adaptations were afterthoughts or quick fixes. They had to be embedded into the core architecture of how we work: from sampling plans to field protocols to backend QC.
The result? We maintained wave-to-wave comparability, even as geographic access shrank. We preserved urban-rural tracking, even when randomization broke down. And we continued to deliver public opinion data that tracked unfolding political events and instances of deadly violence because the systems we built weren’t static. They were responsive by design.
Looking Ahead
We’ve learned that in contexts like Sudan, the question isn’t how to maintain ideal conditions, it’s how to make fieldwork viable when nothing goes as planned. The more we integrated our tools and teams, the more resilient our operations became. That kind of integration wasn’t about innovation for its own sake, it was about keeping the work going and delivering the highest quality data possible amidst a civil war and humanitarian crisis.
______________________________________
1 Sudan — Displacement Situation (11) — 3 July 2023 | Displacement Tracking Matrix